By Myles Chykerda on March 21, 2017
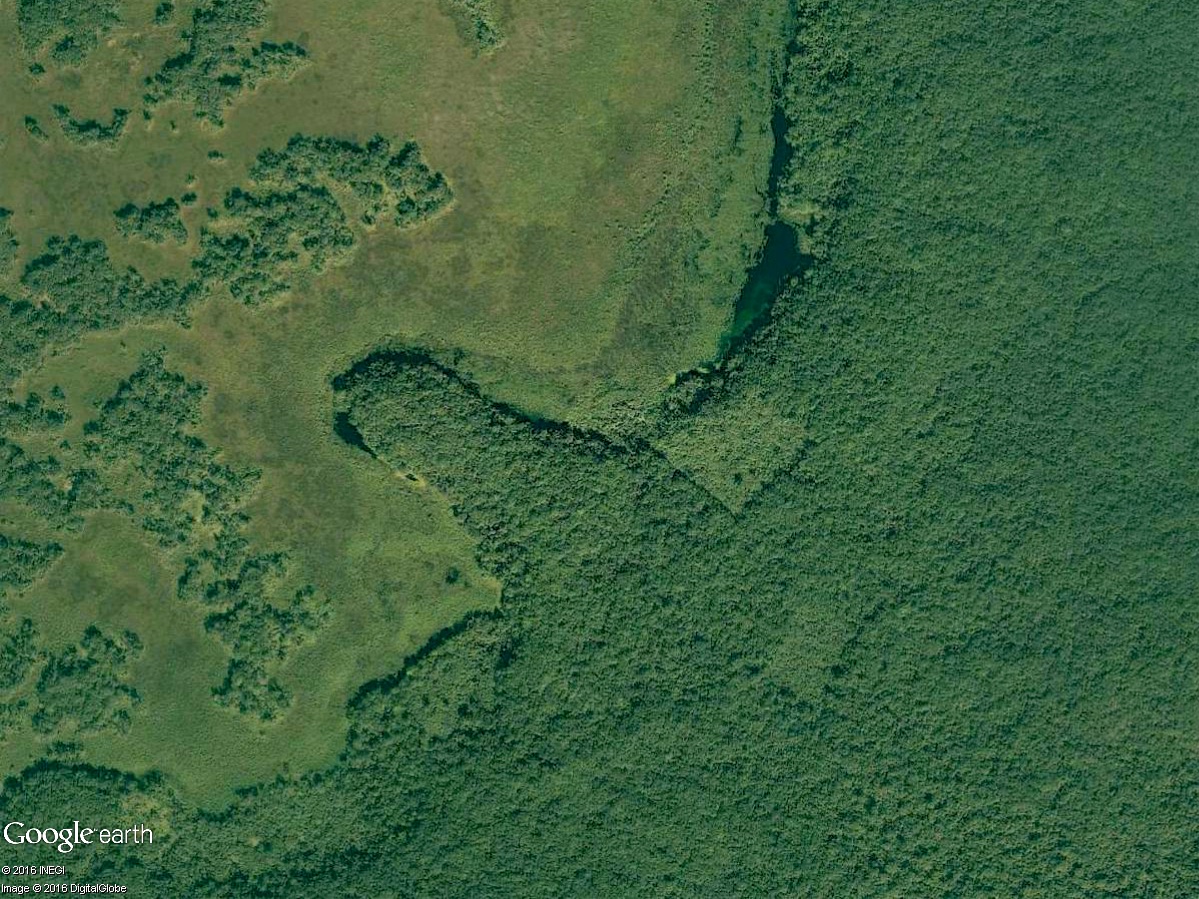
Returning to the online world, we often see such twisting of truths by reports that take grasp of a scientific study and report only a single, sensational line from what may be a complex and lengthy study. An archaeological example of this phenomenon occurred in May 2016 when reports broke that a Quebec teenager discovered massive Mayan ruins through the superimposing of star charts on positions of known cities. The Canadian Space Agency trained their satellites at the area of a predicted site and, voila, what was shown was quickly interpreted as a city so massive it became a wonder how archaeologists never discovered it.
After a few days, professional Mayanologists weighed in, and the discovered city ended up being an abandoned field. Gadoury’s theory of cities aligned to constellations was noted as interesting but impossible to test. Reality managed to push through the glossy allure of sensational headlines.
Another area where an illusion of certainty can be problematic even in the core of academia is in the realm of Geographical Information Systems (GIS). GIS allows a researcher to produce any number of visualizations related to topographic and geographic input. One such analysis that has become very popular in the realm of archaeology is Least Cost Path, an algorithm that suggests a path that offers the least resistance between two dots on a map (an origin and a destination). It is often used in considering how people move through a region and choose the navigation routes that they do.
When presented with a Least Cost Path, a reader sees a digitally produced map that is likely highly refined and annotated. Atop this graphically impressive map is a single line showing the path extrapolated by the system. By virtue of the fact it was produced by a machine, the line is easily trusted as something real and true. This path must be that taken by individuals traversing the landscape.
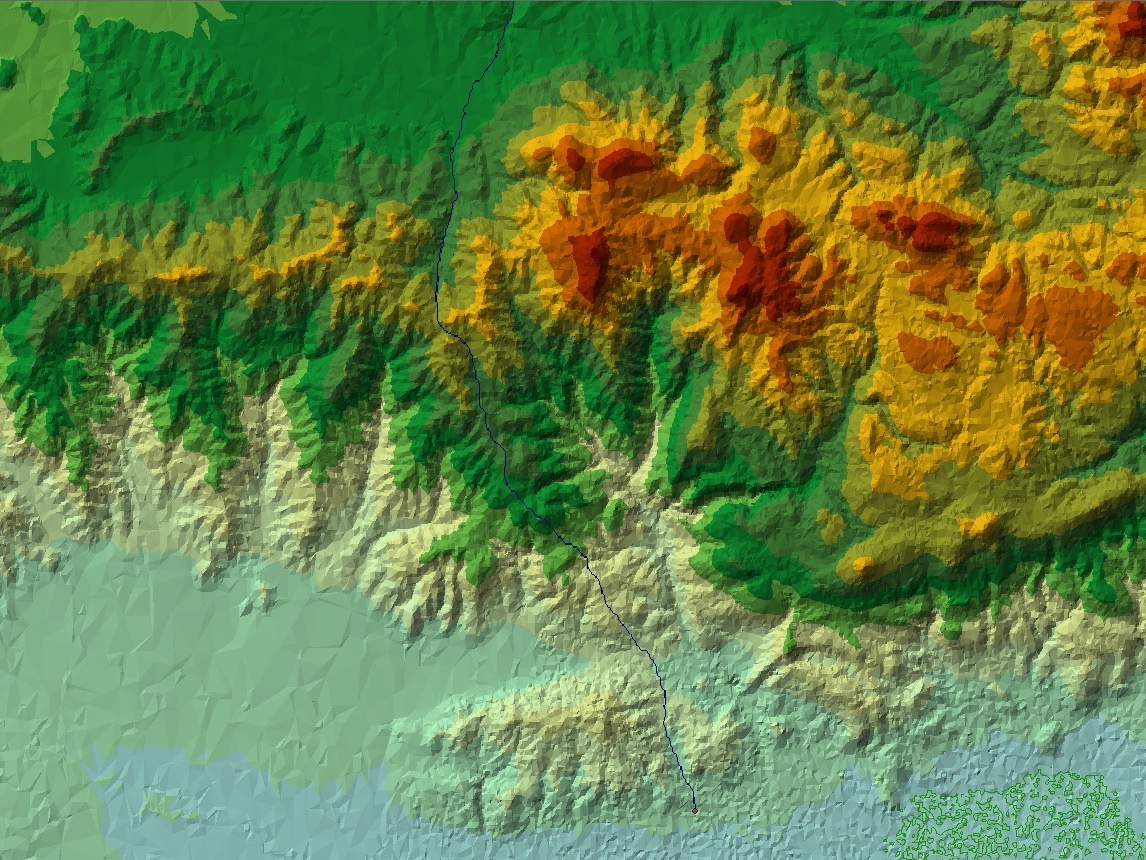
Yet the line of a map does not visually display the factors that went into its creation. In attempting to create an easiest route from Point A to Point B in the digital simulation of a geographical region, what factors does the system weigh? Very often a Least Cost Path relies heavily on slope, that is, how steep the terrain is. This information is calculated from a Digital Elevation Map, which in itself is a digital simulation (potentially created at any level of resolution) of real world topography. Our simulated route is created from something that is itself a simulation, and the responsible algorithm may be considering only one element of the simulation.
In reality, an individual agent may choose a particular route for any number of reasons. A longer path along a steeper slope may be followed due to personal decisions: one may be required to pass a sacred spot or simply desire to take the scenic route. Those who drive in Los Angeles are likely well aware that the simulacrum of Google Maps may often be a stark contrast from the reality of traffic presented before the headlights. The digital representation must be constantly queried and tested; it never is a truly accurate reflection of reality.
It is just as critical to constantly question digital research methodologies. Technological results, whether it be a Least Cost Path or a 3D reconstruction of a Hellenistic Greek house, offer powerful methods to visualize and present data, but in no way possess an inherent quality of infallibility. Those viewing the data should be bold and ask questions, while the researcher responsible for the work should welcome such questions and know exactly what went into the visualization work and openly discuss both the strengths and weaknesses of a particular methodology.
Bauldrillard lays this situation out, a world where we trust the simulations before us more than the reality surrounding us, noting that the simulacrum becomes “the real for the real, fetish of the lost object – no longer object of representation, but ecstasy of denegation and of its own ritual extermination: the hyperreal.”
Featured image: Photographic excerpt by Thomas Garbelotti of an original work by Eyvind Earle (Landscapes, 1970-96). Viewed and photographed at the Los Angeles County Museum of Art.
Additional image: WikipediaBaudrillard20040612-cropped.png by user Europeangraduateschool used under the Creative Commons Attribution-Share Alike 2.5 Generic license. (https://commons.wikimedia.org/wiki/File:Jean_Baudrillard.png#/media/File:WikipediaBaudrillard20040612-cropped.png)
Myles Chykerda is a Research and Instructional Technology Consultant (RITC) at the UCLA Center for Digital Humanities, and is a PhD Candidate in the Cotsen Institute of Archaeology where he researches the development of early states in Thessaly, Greece using landscape and regional archaeological methodologies. Through a combination of technology and traditional archaeological data, he challenges the traditional idea that northern Greek states were less advanced versions of their southern neighbors. Technology and visualization methods also take a central role in his teaching practices, particularly in courses dealing with Mediterranean material culture.
Resources:
- “That Long-Lost Mayan City a Teen Found Isn’t Lost … or a City”, Wired Magazine (https://www.wired.com/2016/05/long-lost-mayan-city-teen-found-isnt-lost-city/)
- “Creating the least-cost path” (http://pro.arcgis.com/en/pro-app/tool-reference/spatial-analyst/creating-the-least-cost-path.htm)
- “Quebec teen uses stars to locate possible lost Mayan city in Mexican jungle”, CBC News (http://www.cbc.ca/news/canada/montreal/william-gadoury-quebec-teen-mayan-lost-city-csa-1.3575416)